Finance
Investment calculator
See what a starting sum and regular contributions could grow to at a steady rate of return, and how much of the final balance is your own money versus growth. Or set a target and find the contribution that reaches it.
━ Balance ┄ Total paid in
| Year | Added | Growth | Total paid in | Balance |
|---|---|---|---|---|
| 1 | $6,000.00 | $919.19 | $16,000.00 | $16,919.19 |
| 2 | $6,000.00 | $1,419.38 | $22,000.00 | $24,338.58 |
| 3 | $6,000.00 | $1,955.73 | $28,000.00 | $32,294.31 |
| 4 | $6,000.00 | $2,530.85 | $34,000.00 | $40,825.16 |
| 5 | $6,000.00 | $3,147.55 | $40,000.00 | $49,972.70 |
| 6 | $6,000.00 | $3,808.82 | $46,000.00 | $59,781.53 |
| 7 | $6,000.00 | $4,517.90 | $52,000.00 | $70,299.43 |
| 8 | $6,000.00 | $5,278.24 | $58,000.00 | $81,577.68 |
| 9 | $6,000.00 | $6,093.55 | $64,000.00 | $93,671.22 |
| 10 | $6,000.00 | $6,967.79 | $70,000.00 | $106,639.02 |
| 11 | $6,000.00 | $7,905.24 | $76,000.00 | $120,544.25 |
| 12 | $6,000.00 | $8,910.45 | $82,000.00 | $135,454.70 |
| 13 | $6,000.00 | $9,988.32 | $88,000.00 | $151,443.02 |
| 14 | $6,000.00 | $11,144.12 | $94,000.00 | $168,587.14 |
| 15 | $6,000.00 | $12,383.47 | $100,000.00 | $186,970.62 |
| 16 | $6,000.00 | $13,712.41 | $106,000.00 | $206,683.03 |
| 17 | $6,000.00 | $15,137.43 | $112,000.00 | $227,820.45 |
| 18 | $6,000.00 | $16,665.45 | $118,000.00 | $250,485.91 |
| 19 | $6,000.00 | $18,303.94 | $124,000.00 | $274,789.85 |
| 20 | $6,000.00 | $20,060.87 | $130,000.00 | $300,850.72 |
| Total | $120,000.00 | $170,850.72 | $130,000.00 | $300,850.72 |
Show the working, step by step
Convert the 7.00% annual return, compounded monthly, to a rate per month (contributions are made 12 times a year).
i = (1 + 0.0700 ÷ 12)^(12 ÷ 12) − 1 = 0.583333% effective annual rate = 7.2290%
Grow the initial amount over n = 12 × 20 = 240 periods.
$10,000.00 × (1 + 0.005833)^240 = $40,387.39
Add the future value of the $500.00 contributions, paid at the end of each month.
FV = PMT × ((1 + i)^n − 1) ÷ i = $500.00 × 520.9267 = $260,463.33
Add the two parts.
end balance = $40,387.39 + $260,463.33 = $300,850.72
Split the balance into what you paid in and what it earned.
paid in = $10,000.00 + $500.00 × 240 = $130,000.00 growth = $300,850.72 − $130,000.00 = $170,850.72
These results are estimates from the figures you entered. Real returns vary from year to year, and fees and taxes are not included. This is a calculation, not financial advice.
The formula
FV = P(1 + i)^N + PMT × ((1 + i)^N − 1) ÷ i
P is the initial amount, PMT the regular contribution, N the number of contributions and i the return per contribution period. When contributions are made at the start of each period, the second term is multiplied by (1 + i). If the compounding frequency differs from the contribution frequency, the annual rate r compounded n times a year is converted to a rate per contribution period:
i = (1 + r/n)^(n/p) − 1 (p = contributions per year)
A worked example
The default inputs are $10,000 to start, $500 at the end of every month, a 7% annual return compounded monthly, over 20 years.
- Monthly rate: i = 0.07 ÷ 12 = 0.58333%. Number of contributions: N = 12 × 20 = 240.
- Initial amount: $10,000 × 1.0058333^240 = $40,387.39.
- Contributions: $500 × (1.0058333^240 − 1) ÷ 0.0058333 = $500 × 520.9267 = $260,463.33.
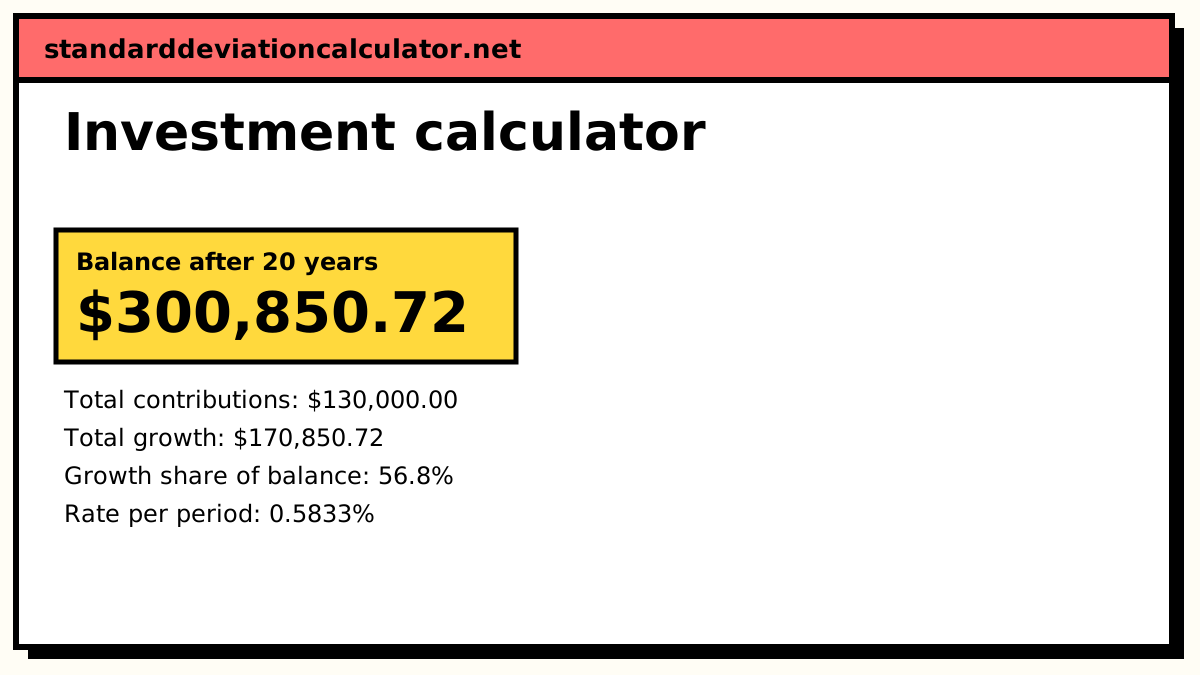
- End balance: $40,387.39 + $260,463.33 = $300,850.72.
You pay in $10,000 + 240 × $500 = $130,000, so $170,850.72 (57% of the balance) is growth. That share rises the longer the money is left: most of the growth comes in the later years, which the chart shows as the widening gap between the two lines.
Reading the result
- The rate is an assumption. Markets do not return 7% every year. A sequence of good and bad years with the same average can end with a different balance.
- The figures are in future money. At 3% inflation, $300,850 in 20 years buys roughly what $166,600 buys today. Use the inflation calculator to convert.
- Fees and taxes are not included. A 1% annual fee takes the 7% return to about 6%, which is a noticeably lower balance over 20 years.
How long the money is invested matters most
For the same $500 a month at 7% with no initial amount, the balance after 10 years is about $86,500; after 20 years, about $260,500; after 30 years, about $610,000. Doubling the time more than doubles the result because each year’s growth earns growth of its own.
These results are estimates for planning. They are not a forecast of any particular investment and not financial advice.
Common questions
How is the end balance of an investment calculated?
It is the future value of the starting amount plus the future value of the regular
contributions: FV = P(1 + i)^N + PMT × ((1 + i)^N − 1) ÷ i, with i the return per
contribution period and N the number of contributions. $10,000 plus $500 a month for 20 years
at 7% compounded monthly comes to $300,850.72.
Does it matter whether I contribute at the start or end of the month?
A little. Money paid in at the start of each period earns one extra period of growth. In the default example, switching to start-of-month contributions raises the balance from $300,850.72 to $302,370.09. Over short periods the gap is small; the bigger lever is how much you contribute and for how long.
What return should I assume?
There is no right figure, and this page does not recommend one. A fixed deposit or bond fund has a lower and steadier return than a stock fund, whose yearly returns swing widely. Try several rates, say a cautious, a middle and an optimistic one, and plan around the cautious result. Subtract fund fees from the rate you enter.
How do I find the monthly amount needed to reach a target?
Choose “Contribution needed for a target”. The calculator grows the initial amount, takes that away from the target, and divides the gap by the annuity factor. Reaching $500,000 in 20 years from $10,000 at 7% needs $882.30 a month.
Is this the same as a SIP calculator?
Yes. A systematic investment plan (SIP) is a fixed monthly contribution to a mutual fund. Set the currency to ₹, the initial amount to 0 and the contribution to your SIP amount. Real fund returns vary month to month, so the result is an estimate, not a promise.
Related calculators
-
Compound interest
The formula behind the growth, with the rule of 72.
-
Retirement calculator
Whether your savings will fund the income you want.
-
Inflation calculator
What a future balance is worth in today’s money.
-
Finance (TVM) calculator
Solve N, I/Y, PV, PMT or FV directly.
-
Portfolio standard deviation
How volatile a mix of investments is.